Sustainable urban mobility indicators can assist cities and urban areas in identifying the strengths and weaknesses of their mobility systems and in focusing on areas for improvement. This is especially important for assessing mobility issues in low-income communities. Several ranges of indicators have been prepared:
Regional (for Europe, Asia and the Pacific as well as North America)
National (for France, India and New Zealand)
City Specific (Bremen)
n
Global Indicators
Global | 2015 | English
Indicators of urban poor communities and their accessibility | UN HABITAT
UN HABITAT has developed a set of indicators to assess the accessibility of low-income communities. The indicators are grouped into three areas: affordability, availability and acceptability. These indicators are designed to be used with the UNEP
Urban Poor Accessibility Assessment Tool.
Global | 2020 | English
SiMPlify | WBSCD
The World Business Council for Sustainable Development (WBSCD) has developed an updated version of its sustainable urban mobility indicators called "SiMPlify" and an online mobility tool help cities identify and address mobility challenges. SiMPlify’s strength lies in the 300 mobility solutions it has collected from cities around the world, based on best practice. These solutions are matched to a city’s indicators and give clear ideas for implementing solutions that address the identified gaps.
Global | 2022 | English
Urban Mobility Readiness Index | Oliver Wyman Forum
The 2022 edition of Oliver Wyman Forum’s Urban Mobility Readiness Index (UMRI) covered 60 global cities. They were selected because of their distinct mobility challenges and the varied solutions they are pursuing. They tend to be leaders in understanding the importance of mobility and serve as economic epicenters for their regions, making their efforts to improve mobility vital to the growth of much wider areas. They were also chosen because data is available to assess, compare, and track the evolution of their mobility capabilities. The UMRI uses five basic dimensions to rank cities: infrastructure, social impact, market attractiveness, system efficiency, and innovation. These five dimensions, in turn, are comprised of a total of 57 metrics (key performance indicators) that collectively identify which cities are ready to excel in meeting their future mobility challenges.
n
Regional Indicators
Europe | 2020 | English
Sustainable Urban Mobility Indicators (SUMI) | EU
The European Commission has therefore developed a comprehensive set of 18 practical and reliable indicators that support cities to perform a standardised evaluation of their mobility system and to measure improvements that result from new mobility practices or policies. To validate these indicators, a group of almost 50 pilot cities has voluntarily filled in and submitted a total of 473 indicator spreadsheets. The starting point for the SUMI project were the "SMP2.0 Sustainable Mobility Indicators"1 developed by WBCSD (the World Business Council for Sustainable Development). These were subsequently revised by the SUMI consortium for use by European cities. The indicators are available on the
SUMI website
and in the
SUMI Report
published in 2020 by Rupprecht Consult. The entire indicator set can be downloaded from the SUMI website
here.
Europe | 2020 | English
SUMP Self-Assessment Tool | CIVITAS
The CIVITAS SUMPS-UP programme has developed a
SUMP Self-Assessment Tool that helps to evaluate and improve mobility planning in a city or functional urban area. It can be used to assess the quality of a specific strategic mobility plan and planning activities in general. To achieve an assessment there are tailored sets of questions depending on the planning context and interest (a mobility plan, or planning activities in general).
Europe | 2019 | English
Urban Mobility Indicators for Walking and Public Transport | UITP
The International Association of Public Transport (UITP) and the Walk21 Foundation has published a common set of urban mobility indicators and best practice case studies on the walkability of cities and access to public transport in Europe. These are designed to allow cities to benchmark themselves against other cities of a similar size and learn from each other. Adopting these indicators will also ensure that future investments in walking and public transport are effective and a value for money. The indicators are a mix of objective, satisfaction and quality measures. The objective measures relate to the data that is already collected by operators and government agencies or can be calculated from available datasets. The satisfaction measures result from surveys of the population and the quality measures reflect the quality of walking and public transport infrastructure that are typically measured at a neighbourhood scale.
Asia and the Pacific | 2022 | English
Asian Transport Outlook (ATO) Urban Database | ADB
Asian Transport Outlook (ATO)
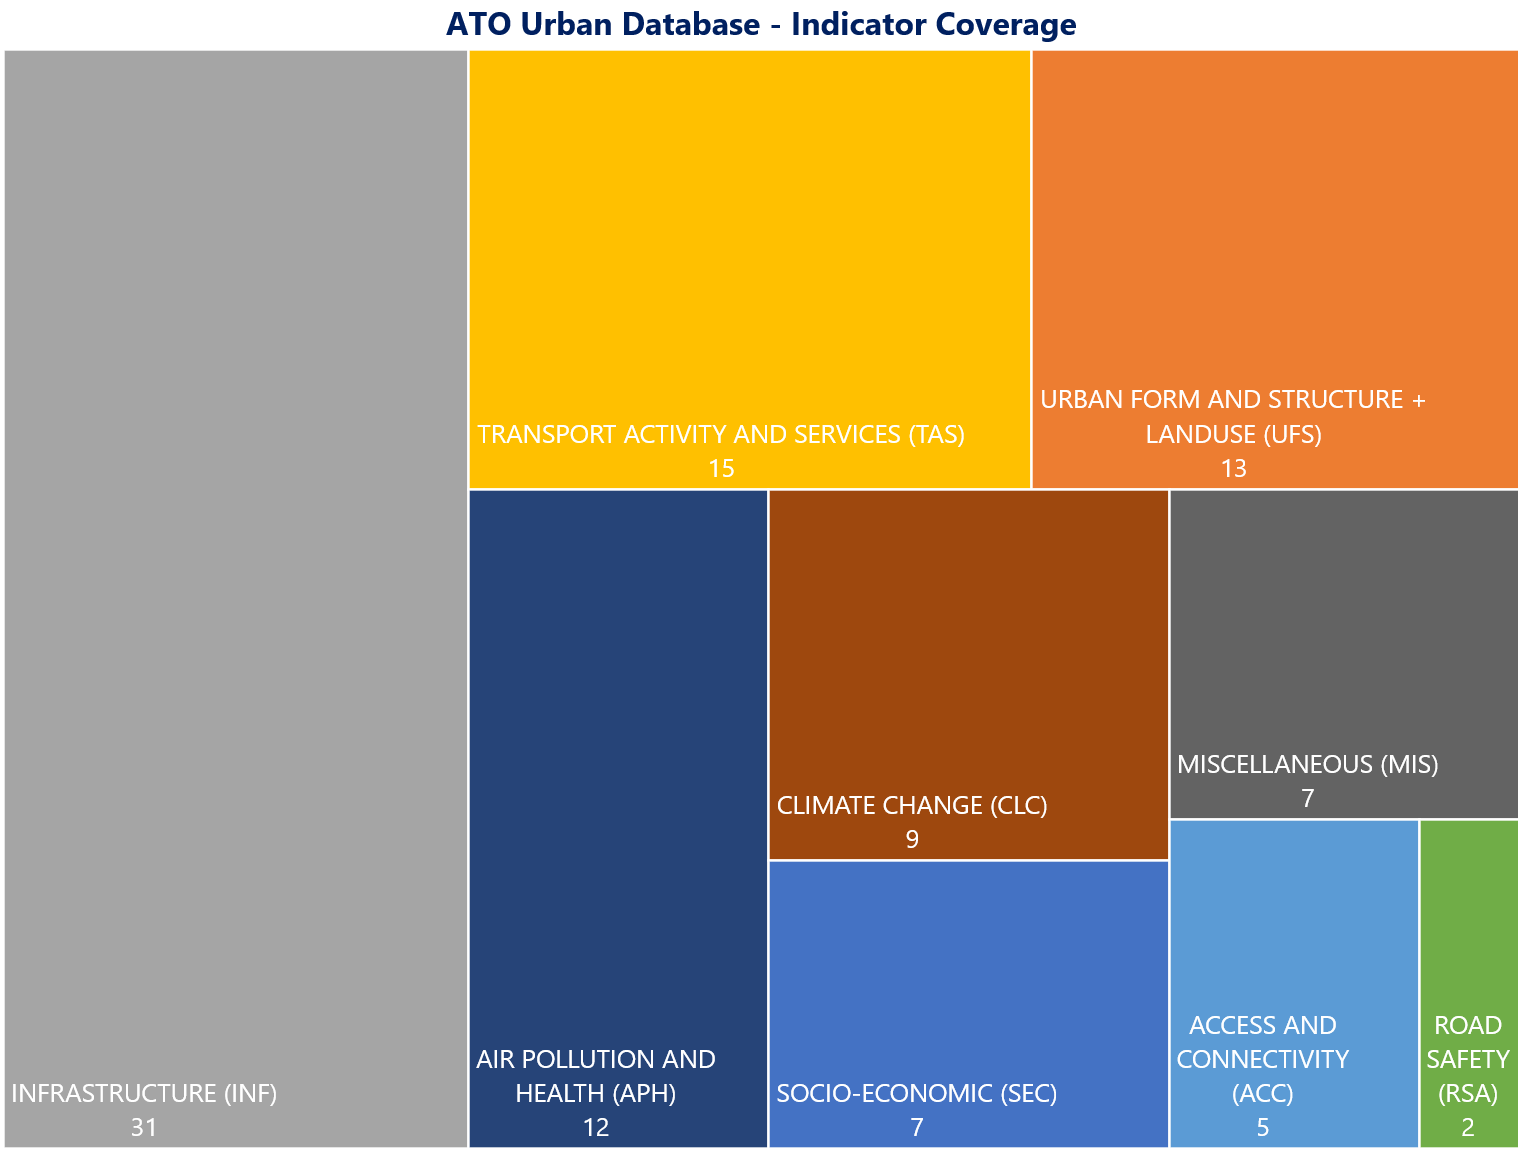
is initiated by the Asian Development Bank (ADB) to strengthen the knowledge base on transport in the Asia-Pacific region. The ATO Urban Database contains indicators on Infrastructure, Urban Form, Structure and Land-use, Activity and Services; Access and Connectivity, Road safety; Air Pollution and Health; Climate Change; Socio-Economic; and Miscellaneous. A detailed assessment on selected 41 urban centres was conducted which provided additional detailed indicators, transport-related targets, and city-level policies. The database is available in Excel format and can be downloaded
here. It will be available
here in 2023.
Asia and the Pacific | 2017 | English
Assessment of Urban Transport Systems | ESCAP
This study report presents the process of development of the Sustainable Urban Transport Index (SUTI), a tool that can be used for assessment and evaluation of sustainable urban transport systems for cities in the Asia-Pacific region. The report explains and illustrates how such an index was developed. The index is based on a set of indicators that reflect the various modes of transport systems, social, economic and environmental dimensions of sustainable urban transport and refer to contributions of transport within the relevant dimension of and goals for sustainable development. The report provides a summary of the conceptual basis and the process of selecting sustainable transport indicators and developing the index. It describes the proposed indicators in detail and presents the design of the Sustainable Urban Transport Indicators (SUTI) with examples.
Asia and the Pacific | 2019 | English
Sustainable Urban Transport Index (SUTI) | ESCAP
The
Sustainable Urban Transport Index (SUTI) is a framework of indicators for the assessment of urban transport systems and services in a city. It has been developed by UN Economic and Social Commission for Asia and the Pacific (ESCAP) to help summarize, track and compare the performance of Asian cities with regard to sustainable urban transport and the related Sustainable Development Goals (SDGs). It includes ten indicators in system, economic environmental and social domains. SUTI has been successfully applied in 10 cities; Bandung, Colombo, Dhaka, Hanoi, Greater Jakarta, Ho Chi Minh City, Kathmandu, Surabaya, Surat and Suva.
North America | 2019 | English
Indicators for Sustainable Mobility | ITDP
The Institute for Transportation and Development Policy (ITDP) has developed a suite of Indicators for Sustainable Mobility that can be used to effectively develop sustainable transportation policies in a city and to measure their effectiveness. These indicators measure a variety of different aspects of sustainable transit and can be broadly grouped into three categories: proximity, access, and city characteristics. The goal is to provide city officials with the tool necessary to understand transportation conditions and make informed policy interventions that improve sustainable transportation. The indicators developed by ITDP have been tested in 25 cities in North America (Canada, Mexico and the USA) to measure their sustainable transport systems. The indicators are easily understood and replicable, and they rely on open-source data. By using transparent and actionable indicators, the results can be easily communicated to politicians and communities.
n
National Indicators

France | 2022 | French
MOBILITÉS DU QUOTIDIEN | CEREMA
Dedicated to daily mobility in France, with a retrospective look at the 2010 decade, this report follows a series of three ten-year reviews started in the 1980s. The richness of its analysis makes it possible to understand the current dynamics and identify the challenges of the future mobilityt policies. All forms of mobility are covered, from local transport on foot or by bike to delegated digital mobility. All modes of journeys are mentioned: public or individual transport, traditional or innovative. The diversity of the analysis will interest a wide audience ranging from elected officials and technicians from local authorities to researchers and students, via other public decision-makers, consultancies or associations. The analysis has been undertaken from a variety of data sources including home interview surveys.
India | 2019 | English
How Urban India Moves | CEEW
The urban mobility landscape in India is rapidly evolving. Population growth, rising income levels, increasing motorisation and changing preferences are among the factors driving change in how people move in a city. Monitoring and shaping urban mobility through periodic data collection and analysis is currently limited in India. This study has captured through a primary survey, travel and commute characteristics as well as preferences and perceptions of 3,682 urban citizens. It also covered diverse geographical zones and cities in India. The survey asked residents of urban India about the modes of transport they used. Walking (more than 500 m) and public transport use were reported by a large share of respondents. However, motorbikes are the second-most used mode of transport, a worrying sign, because this mode, while filling the void left by deficiencies in public transport is contributing to urban congestion and adding to the bulk of petrol use in the economy.
New Zealand | 2022 | English
Benchmarking Sustainable Urban Mobility | NZTA
The New Zealand Transport Agency undertook a benchmarking analysis of five urban centres in New Zealand to ascertain how urban centres compare on their journeys toward delivering a low carbon, safe and healthy urban mobility environment.
n
City Specific Indicators
Bremen | 2016 | English
Bremen Urban Mobility Plan Target Indicators
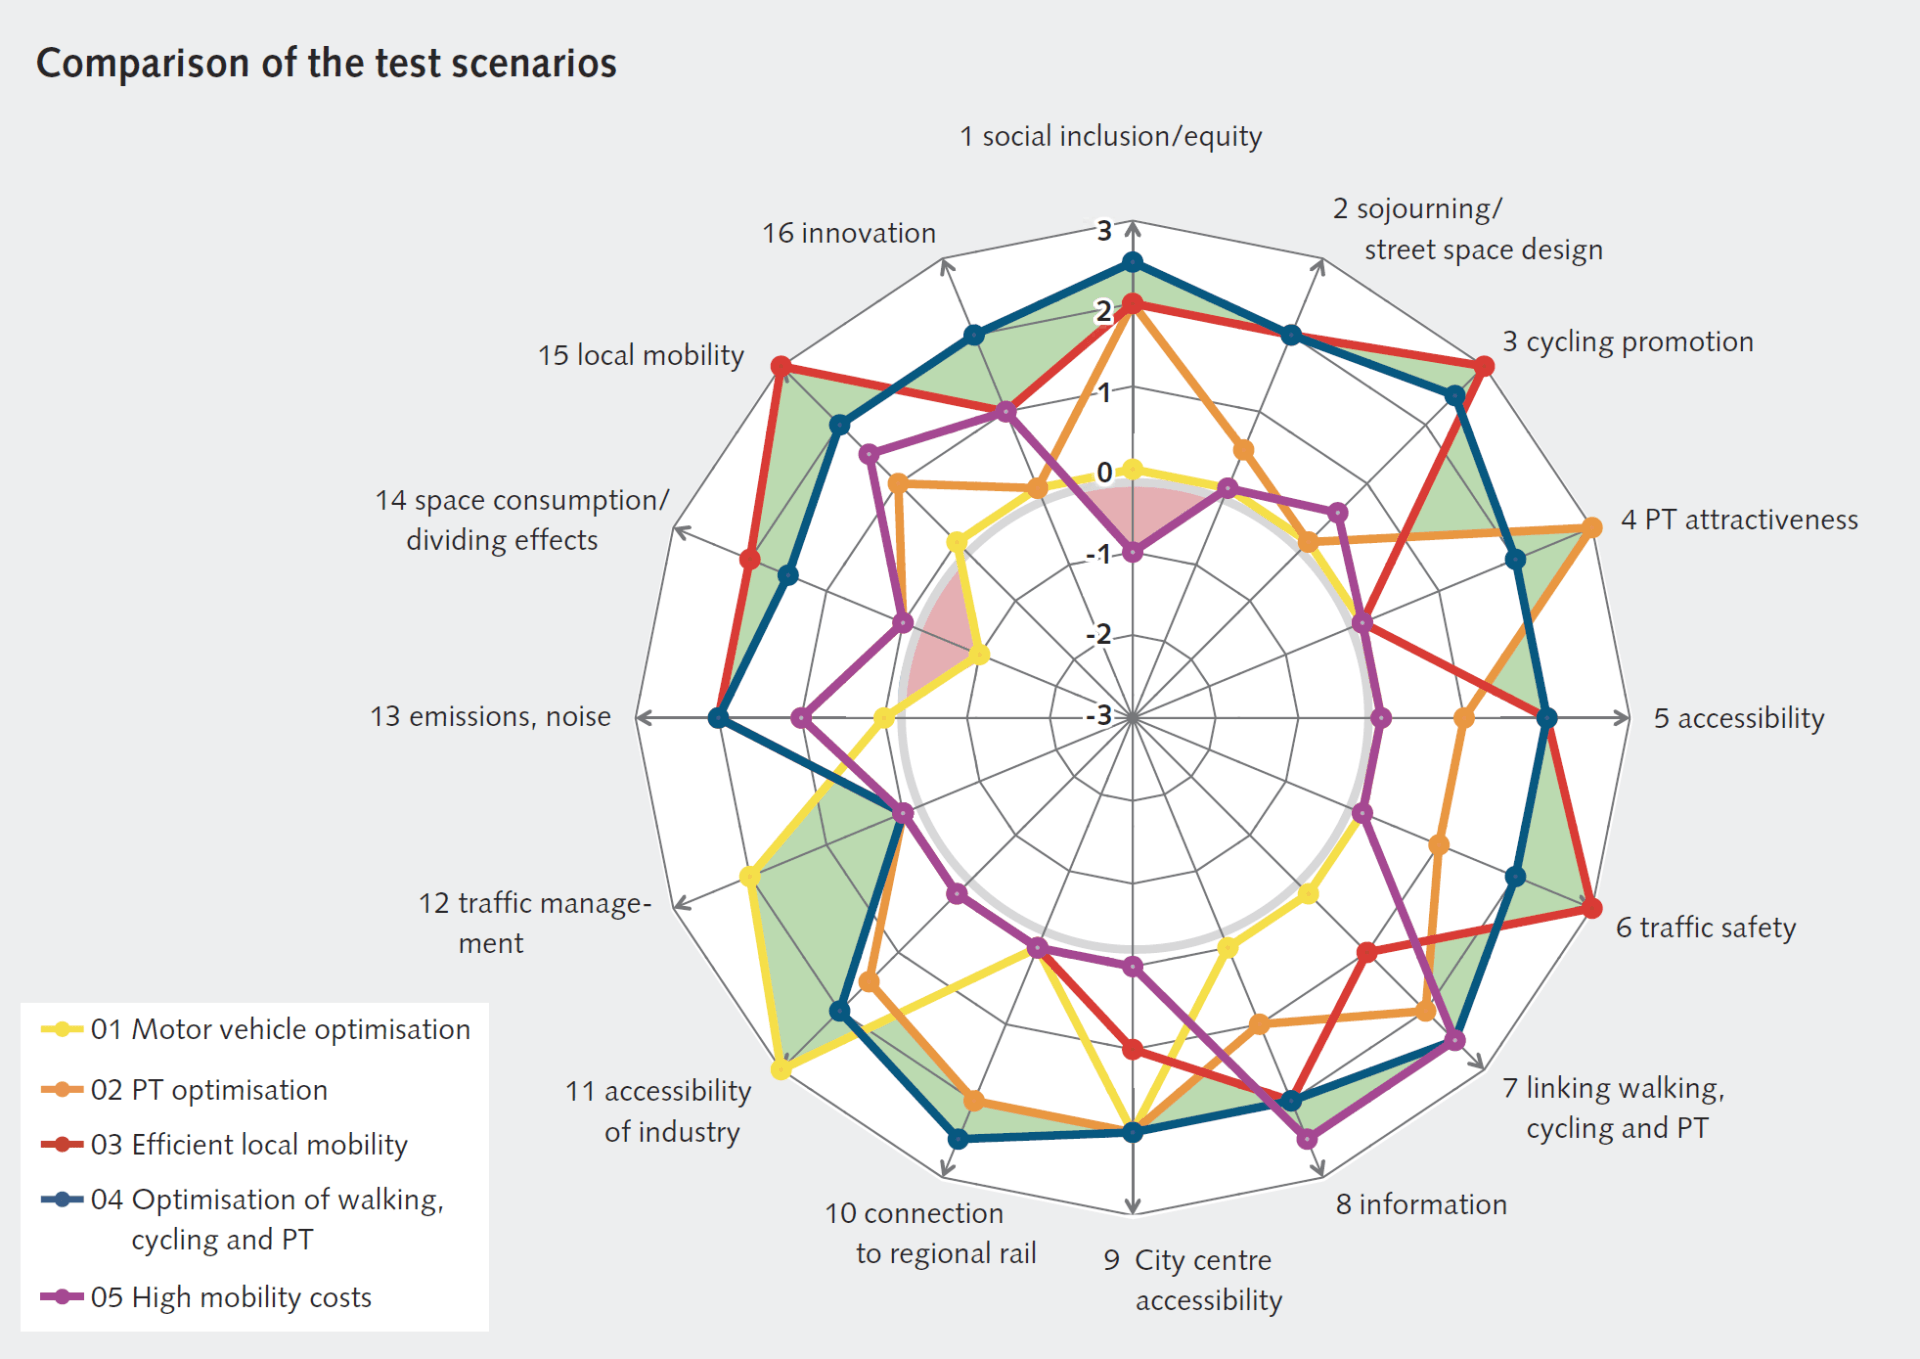
The Bremen Urban Mobility Plan used 16 target indicators for the qualitative comparison of packages of measure for the five test scenarios that had been developed. This enabled a goal-focussed comparison of the impacts of the test scenarios. Using these indicators, it was possible for each test scenario, to identify the strengths with regard to the degree of achievement of the scenario and its package of measures.


